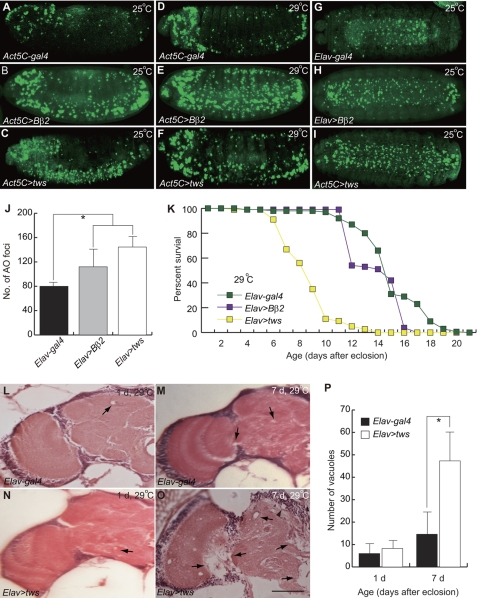
FIGURE 1.
Ectopic Tws caused neuropathies. Transgenic construct was constitutively overexpressed with the Act5C-gal4 or Elav-gal4 driver, and apoptotic cells were revealed by AO staining. Transgenic constructs were expressed at 25 °C (A–C and G–I) or 29 °C (D–F). A, control Act5C-gal4 driver flies exhibited normal programmed cell death patterns. B and C, expression of Bβ2 or tws induced cell death, particularly in the ventral cord of embryos. D, cell death was increased slightly in the control Act5C-gal4 driver at 29 °C. E and F, increased AO-positive cells were presented in Act5C>Bβ2 or Act5C>tws embryos. G, normal programmed cell death in the ventral cord of Elav-gal4 flies (ventral view). H and I, neuronal overexpression of Bβ2 or Tws affects viability of neuronal cells in the ventral cord of embryos (ventral view). J, number of dead cells in Elav-gal4 control (black bar), Elav>Bβ2 (gray bar), and Elav>tws (open bar) embryos. Data were expressed as mean ± S.D. values (n = 15) and were analyzed by one-way analysis of variance with supplementary Student-Newman-Kewls (SNK) test. * indicates p < 0.001. K, Tws severely reduces the life span of transgenic flies overexpressing tws at 29 °C. The life span of transgenic flies expressing Bβ2 was also significantly shorter than the control Elav-gal4 (Log-rank test, p = 0.00255). L–O, frontal brain sections of flies were revealed by H&E staining. L and N, neurodegeneration was detected slightly in 1-day-old control Elav-gal4 and Elav>tws flies raised at 29 °C. M, mild vacuolar degeneration was observed in the neuropil (arrow) of 7-day-old Elav-gal4 flies. O, larger and more vacuoles were present in the cortex (arrowhead) and the neuropil (arrow) of aged tws transgenic flies. P, neurodegeneration was assessed by quantification of vacuoles in the brain of flies raised at 29 °C. Number of vacuoles in Elav-gal4 control (black bar) and Elav>tws (open bar) is shown. d, day. Data were expressed as mean ± S.D. values and were analyzed by Student's t test; * indicates p < 0.01. Scale bar, 20 μm.

