FIGURE 4.
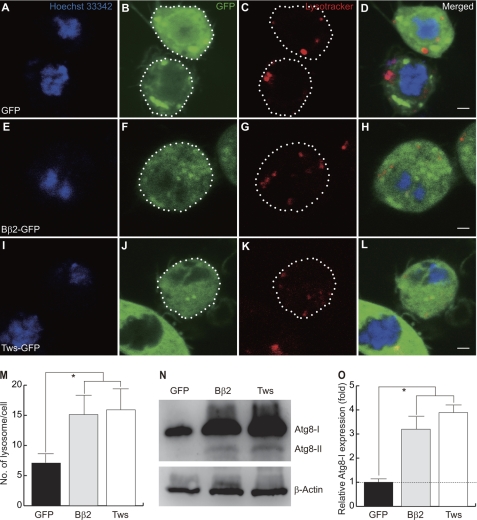
Tws induces autophagic response. Expression constructs are as follows: A–D, GFP; E–H, Bβ2-GFP; I–L, Tws-GFP. Note that ectopic expression of Bβ2 or Tws induced the formation of lysosomes. The outline of transfected S2 cells are marked (green with dotted line). Nucleus (Hoechst 33342), blue; lysosome (LysoTracker), red. Scale bar, 4 μm. M, numbers of lysosomes in S2 cells transfected with GFP (black bar), Bβ2 (gray bar), and Tws (open bar) were compared. Data were expressed as mean ± S.D. values and analyzed by one-way analysis of variance with supplementary Student-Newman-Kewls test. * indicates p < 0.001. N, representative immunoblot showed that Atg-I (∼16 kDa) was presented in the heads of flies. However, a smaller form of Atg8-II (∼14 kDa) was induced only in flies expressing Bβ2 or Tws. Loading control, β-actin. O, quantitative Western blotting analysis of the relative expression levels of Atg8-I. The expression levels were normalized to the β-actin control. Data were expressed as mean ± S.D. values and analyzed by Student's t test; * indicates p < 0.01 (n = 4).

