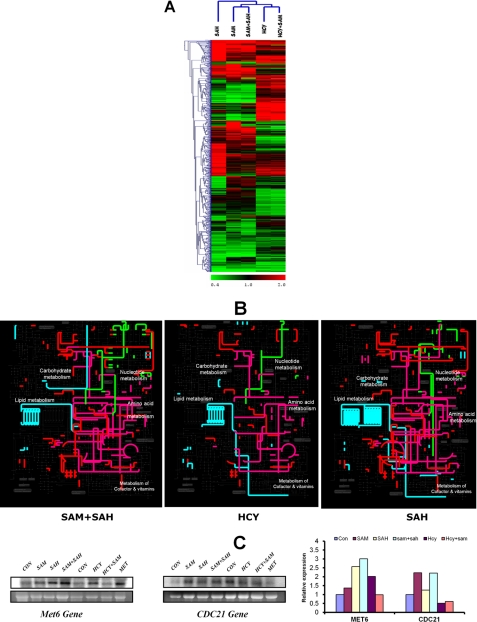
FIGURE 4.
Comparison of differentially expressed genes in str4Δ cells in presence of homocysteine and its precursors. A, heat map of the expression profiles of differentially expressed genes in the presence of AdoHcy (SAH), AdoMet (SAM), AdoMet + AdoHcy (SAM + SAH), homocysteine, Hcy + AdoMet (Hcy + SAM) were compared and analyzed by hierarchical clustering using TIGR Multiexperiment Viewer software (MeV version 4.0). The cluster of groups with similar expression profiles are shown at top and left. B, metabolic map of differentially expressed genes in the presence of AdoMet + AdoHcy, homocysteine, and AdoHcy. The differentially expressed genes were mapped on yeast metabolic network using the web-based tool iPATH. The subset of nucleotide metabolism gene is highlighted in green, lipid metabolism in light blue, amino acid metabolism in purple, and the rest in red. C, expression of Met6 and CDC21 genes was determined by Northern blotting. The cells were grown in the presence and absence of homocysteine and its precursors, and RNA was isolated from these cells. The lower panels in each blot represent gel loading of total RNA. Images were acquired using PhosphorImager and quantified by ImageQuant software.

