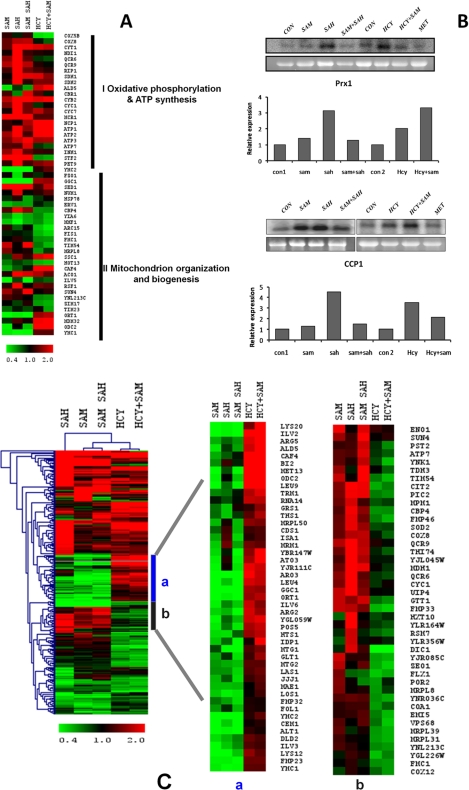
FIGURE 7.
Mitochondrial oxidative stress and transcriptomic response in the presence of AdoHcy and homocysteine. A, comparison of expression profiles of mitochondrial genes in str4Δ strain. Heat map of up-regulated mitochondrial genes in the presence of AdoMet (SAM), AdoHcy (SAH), AdoMet + AdoHcy, Hcy, and Hcy + AdoMet was generated using Multiexperiment viewer software (MeV version 4.0b). B, up-regulation of CCP1 and PRX1 genes in the presence of homocysteine and AdoHcy. The cells were grown in the presence and absence of these metabolites for 16 h, and RNA was isolated from these cells. 20 μg of RNA was loaded per lane for Northern blot analysis. The lower panels in each blot represent gel loading of ribosomal RNA. Image was acquired using PhosphorImager and quantified by ImageQuant software. C, effect of homocysteine and AdoHcy on mitochondrial gene expression. The expression profiles of up-regulated genes in the presence of AdoHcy, AdoMet, AdoMet + AdoHcy, Hcy, and Hcy +AdoMet were compared and analyzed by hierarchical clustering by using TIGR Multiexperiment Viewer software (MeV version 4.0). The portion of genes clustered with similar expression profiles are shown on the right. a, comparison of genes up-regulated in the presence of homocysteine and Hcy + AdoMet and with others. b, comparison of genes down-regulated in the presence of homocysteine and Hcy + AdoMet with others.

