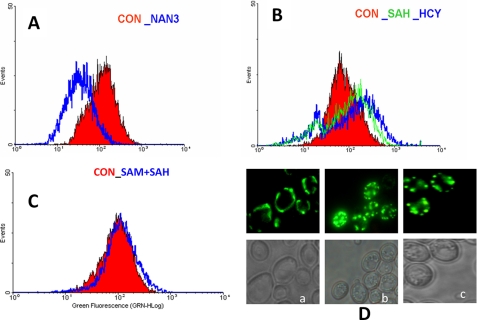
FIGURE 8.
AdoHcy and homocysteine induce mitochondrial membrane potential changes and mitochondrial fragmentation. Evaluation of mitochondrial membrane potential was in str4Δ cells. Yeast cells were grown for 16 h in minimal media containing AdoHcy (SAH) (600 μm), AdoMet (SAM) (600 μm), and homocysteine (5 mm) and after washing were incubated with Rh123 for 20 min and analyzed by flow cytometry. Overlay of fluorescence histograms was after staining with Rh123 dye. A, red histogram is for control, and blue is for sodium azide-treated yeast cells. B, red histogram is for control cells; green is for AdoHcy-treated cells, and blue is for homocysteine-treated cells. C, control cell is shown in red and AdoMet + AdoHcy is shown in blue. D, fragmentation of the mitochondrial network. Mitochondria were visualized using a mitochondria localized GFP protein. Mito-GFP protein-cloned plasmid (Pvt100U) constructs were transformed into str4Δ cells. Yeast cells expressing Mito-GFP were grown in the presence of AdoHcy and homocysteine for 12 h and observed under a fluorescence microscope. Panel a, control; panel b, AdoHcy; panel c, Homocysteine.

