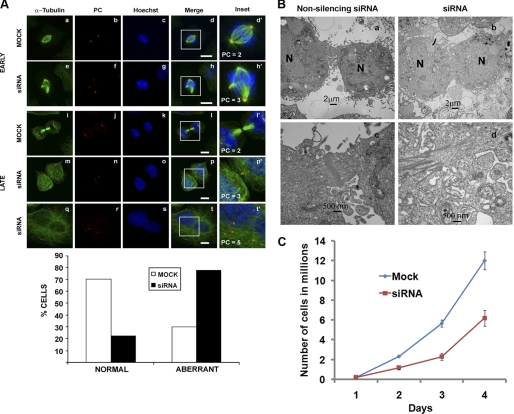
FIGURE 5.
p115-depleted cells display spindle and cytokinesis defects. A, following a 3-day mock or siRNA treatment, HeLa cells were synchronized in S-phase with aphidicolin then processed for immunofluorescence in early (metaphase; a–h) or late (cytokinesis; i–t) mitosis with antibodies against α-tubulin (green) or pericentrin (PC; red). PC positive foci are indicated in the insets. Images are projected confocal Z-sections. The percentage of cells displaying the normal versus aberrant spindle phenotype was quantified in both mock and siRNA-treated cells by counting ∼200 cells. B, electron micrographs of the cytokinetic furrow in synchronized non-silencing (a and c) or p115 siRNA-treated (b and d) HeLa cells collected at 10 h after release from the aphidicolin block (N, nucleus). C, growth curve of mock and p115 siRNA-treated cells. Equal numbers of cells were siRNA (red) or mock (blue) treated at day 0 and cells were counted every day for 4 days following treatment. Data are from three independent experiments. Error bars represent S.D. ± mean. Scale bars, 10 μm.

