FIGURE 1.
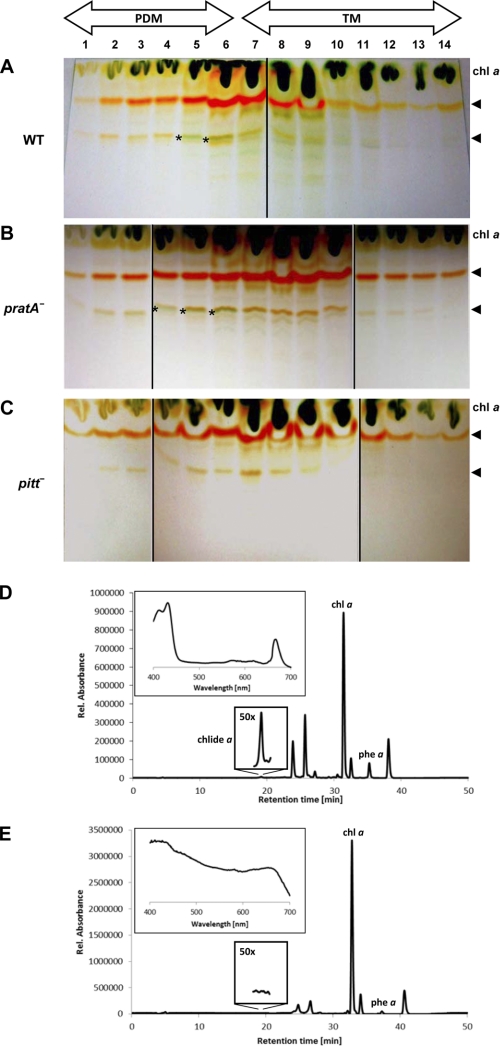
Pigment analysis of PDM and TM fractions. Synechocystis PDMs and TMs of wild-type (A), pratA− (B), and pitt− (C) cells were obtained by two rounds of sucrose density gradient centrifugation. Equal volumes of hydrophobic pigments extracted from each fraction were then subjected to TLC. Asterisks mark a pigment accumulation in PDM fractions that seems to represent chlorophyllide a. Arrows indicate the positions of carotenoids. D and E, HPLC-based pigment analysis of PDM fraction 5 and TM fraction 9, respectively, of wild-type cells. The PDM-specific peak (shown also magnified ×50) was identified as chlorophyllide a (chlide a) based on its retention time and absorption spectrum (inset). At the comparable retention time in TM fraction 9, no characteristic absorption spectrum for chlorophyll derivatives was detectable (inset). Due to their retention times and absorption spectra, other peaks were identified as chlorophyll a (chl a), pheophytin a (phe a), and carotenoids (all unlabeled peaks). Carotenoids were not further specified. Rel., relative.

