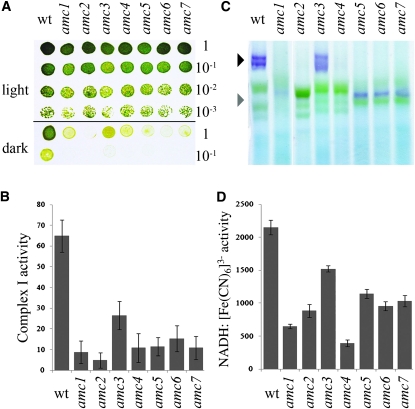
Figure 1.—
Six novel sid mutants display a defect in complex I activity. (A) Tenfold dilution series of amc1–7 and wild-type (wt) cells were plated on acetate-containing medium and incubated 3 days in the light or 5 days in the dark. (B) Complex I-specific activity (nmol NADH reduced/min/mg of protein) is indicated as averages of 10 independent measurements. (C) BN-PAGE and in-gel NBT staining of NADH dehydrogenase activity. The black and gray arrowheads indicate the position of the mature 950-kDa complex I and the 700-kDa subcomplex, respectively. The purple bands indicate staining for NADH oxidase activity in complex I and subcomplexes. Note that complex I is often resolved into two or more purple bands of high molecular weight. The identity of such bands is unclear but they do not correspond to the supercomplex I + III2 (Cardol et al. 2008). The green bands correspond to photosystems I and II and their respective light harvesting complexes of the chloroplast (Rexroth et al. 2003; Cardol et al. 2006). (D) NADH:ferricyanide oxidoreductase activity (nmol K3[Fe (CN)6] reduced/min/mg of protein). The results represent the average of three independent determinations. (B and D) Error bars indicate standard error (SE).

