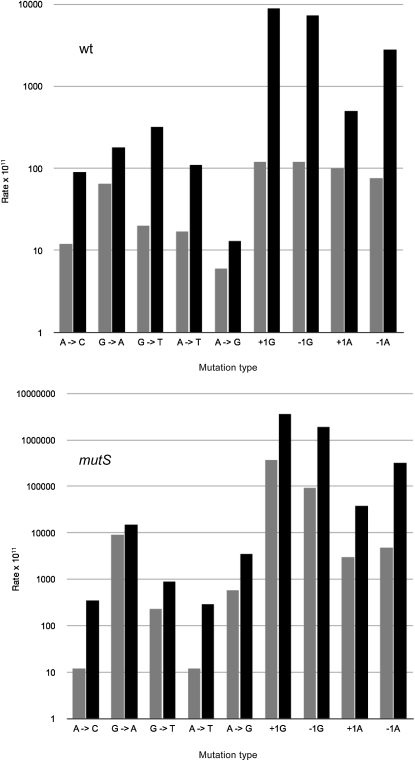
Figure 7.—
Comparison of lacZ reversion rates on the chromosome vs. F′ lac plasmid. Reversion rates of specific mutation events measured on the chromosome (shaded bars) compared to the same alleles carried on F′ lac (solid bars, data from Miller et al. 2002) in wild-type strains (top) or mismatch repair defective, mutS strains (bottom).

