
Figure 1. High-resolution MR scanning of the hippocampus.
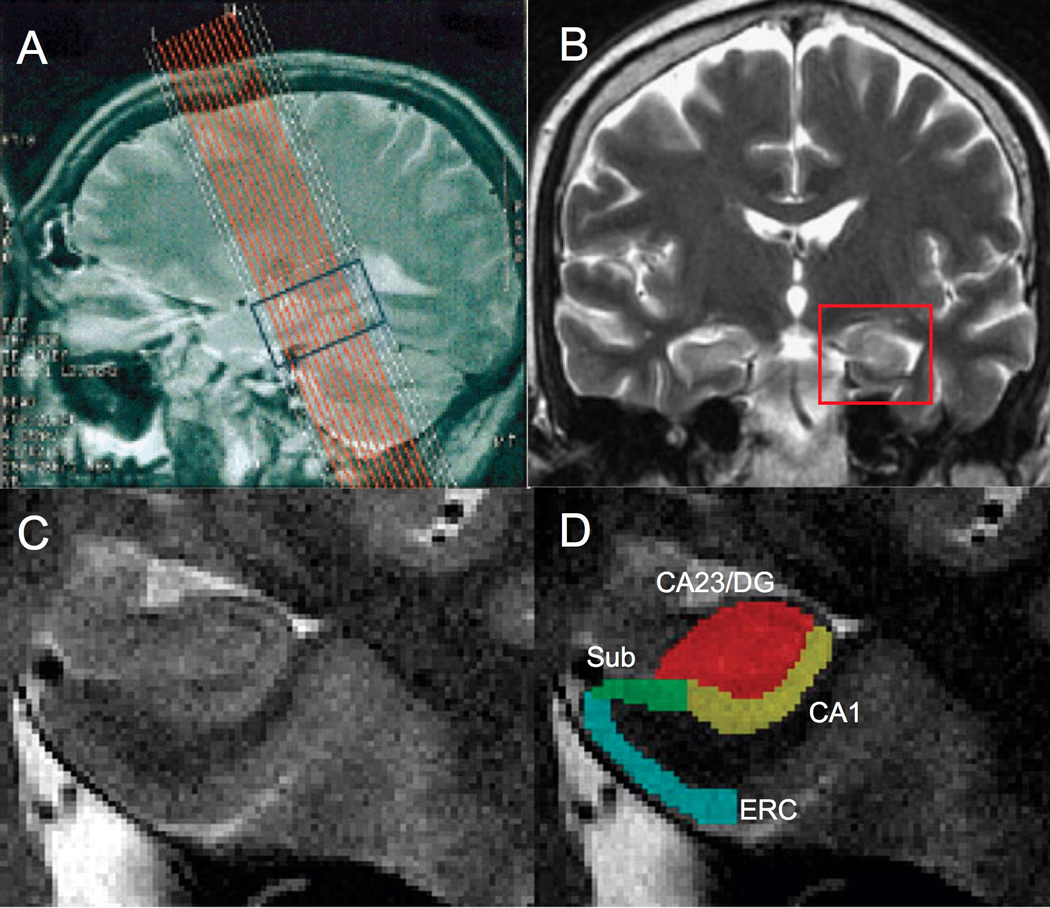
The sagittal T2-weighted scout image illustrates the superimposed slice prescription for 16 coronal structural images covering the hippocampal formation (A). High-resolution T2-weighted coronal image (B) indicating region shown in (C). Magnified images of the hippocampus (C) were segmented using color-coded masks of hippocampal subregions (D). MR scan resolution is not adequate to differentiate the dentate gyrus and CA2 and CA3 fields separately so they are considered as a single subregion (CA23DG). Red = Dentate gyrus and CA2&3 (CA23DG); yellow = CA1; green = Subiculum (Sub), blue = Entorhinal cortex (ERC).