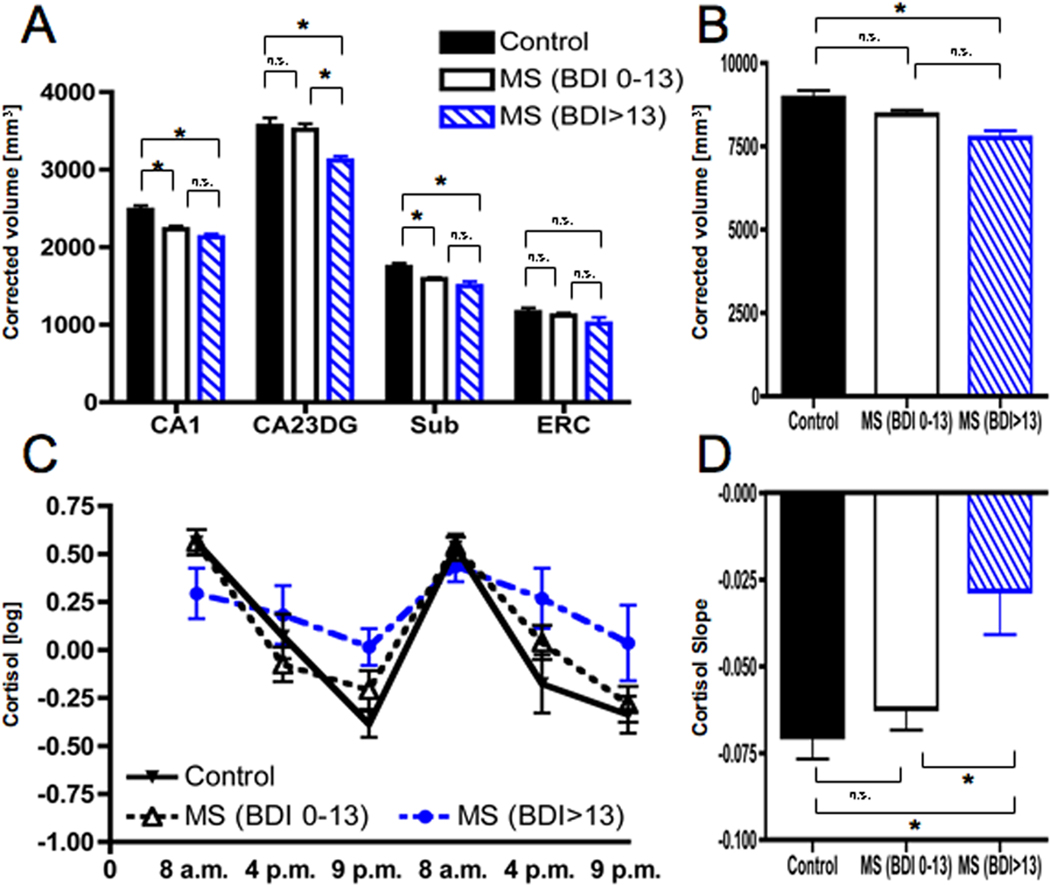
Figure 3. Selective regional hippocampal atrophy and HPA axis activity in MS patients with higher levels of depressive symptoms.
MS patients were classified as non-depressed (BDI-II 0–13, n=21) or mild-to-moderately depressed (BDI-II>13, n=8) according to published cut-offs. Both MS groups showed smaller volumes in Cornu Ammonis 1 (CA1) as well as Subiculum (Sub) compared to healthy controls (n=20). However, only MS patients with elevated depressive symptoms also showed atrophy in CA2–CA3 and the Dentate Gyrus (CA23DG) (A). As a result, only MS patients with depressive symptoms exhibited smaller total hippocampal volumes (B). In addition, only MS with depressive symptoms had elevated evening cortisol levels (C) and thus significantly flatter cortisol slopes (D).

