
Figure 2.
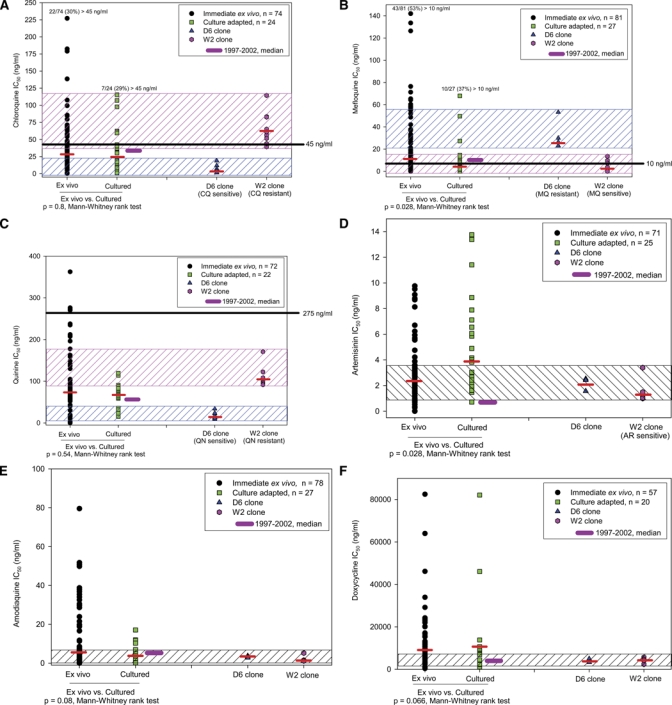
(A–F) SYBR Green I drug IC50s for Plasmodium falciparum field isolates, shown as scatter plot and median (thin black bar). IC50 ranges of P. falciparum reference clones D6 and W2 for chloroquine diphosphate (CQ), mefloquine hydrochloride (MQ), and quinine sulfate hydrate (QN) shown in two hatched boxes; for artemisinin (AR), amodiaquine hydrochloride (AQ), and doxycycline hyclate (DX), in single hatched box. Thick black bars: median IC50 of P. falciparum field isolates obtained 1997–2002 (culture-adapted, radioisotope uptake assay).17 Horizontal solid lines on CQ, MQ, and QN graphs: IC50 threshold values considered discriminative for “resistant” P. falciparum isolates (culture-adapted, radioisotope uptake assay).