Fig. 1.
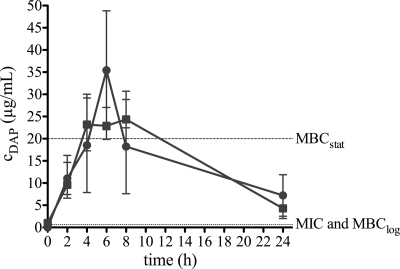
Pharmacokinetics of daptomycin (DAP) in sterile cage fluid of mice after a single intraperitoneal administration of a 30-mg/kg (squares) and 40-mg/kg (circles) dose. Values are means ± SD. The horizontal dotted lines indicate the MIC and MBClog (below) and MBCstat (above) of MRSA (S. aureus ATCC 43300) for DAP.

