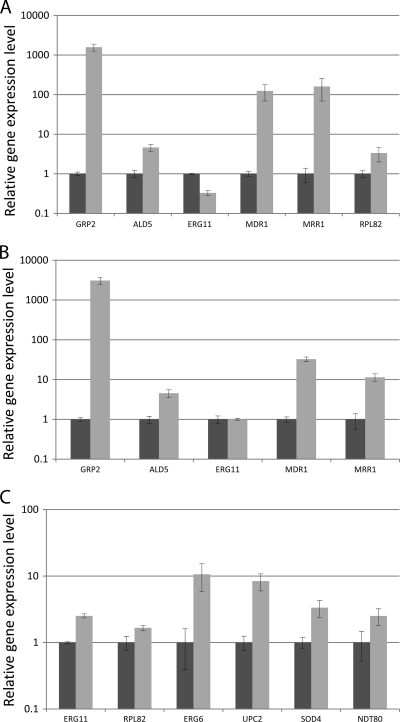
Fig. 4.
RT-qPCR analysis of genes whose expression was found to be altered in microarray analysis and that have been implicated in antifungal resistance (ERG5, ERG11, MDR1, MRR1, NTD80), stress response (GRP2), and metabolism (ALD5, RPL82). Black bars, susceptible strain BC014S; gray bars, BC014RFLC (A), BC014RVRC (B), and BC014RPSC (C) strains. In panels A and B, y-axis scales are logarithmic due to the large variance in gene expression levels. The expression level shown for each gene represents the variation in gene expression relative to the susceptible strain and is expressed as the average with standard deviation of five independent experiments. Each mean value was normalized to the amplification efficiency and to the amount of TUB4 (endogenous reference gene). All genes displayed levels of expression similar to the microarrray results.

