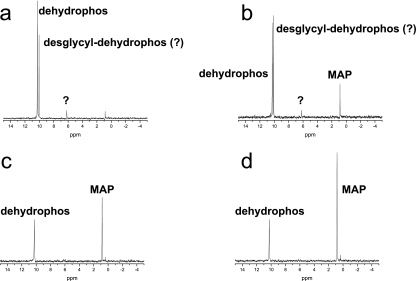
Fig. 5.
PepA catalyzed the degradation of dehydrophos. A time course following the fate of dehydrophos, monitored by 31P NMR, incubated with purified S. enterica PepA is shown. (a) After 1 h, a large peak representing unreacted dehydrophos (10.2 ppm) is present, along with a substantial amount of the putative dipeptide (10 ppm). (b) After 3 h, the putative dipeptide peak dominates the spectrum, and the peak at 1 ppm has increased in intensity. (c) After an overnight incubation, only two peaks remain: a large peak at 1 ppm and a peak representing unreacted dehydrophos at 10.2 ppm. (d) The addition of a synthetic standard identifies the peak at 1 ppm as methylacetylphosphonate (MAP).

