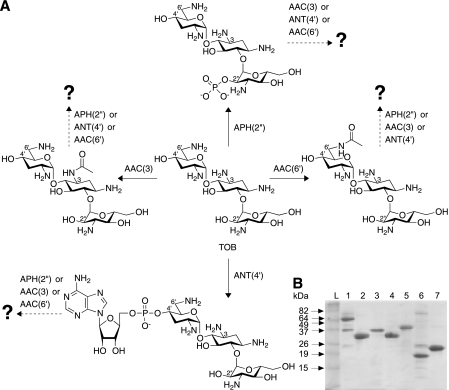
Fig. 1.
(A) Schematic representation of the sequential modifications performed by the AMEs APH(2″), AAC(3), ANT(4′), and AAC(6′), used in this study, with TOB as a representative AG. (B) Coomassie blue-stained 15% Tris-HCl SDS-PAGE gel showing the purified AMEs AAC(6′)/APH(2″)-Ia (56,992 Da) (lane 1), AAC(3)-IV (31,882 Da) (lane 2), APH(2″) (34,791 Da) (lane 3), ANT(4′) (33,299 Da) (lane 4), AAC(3)-Ib/AAC(6′)-Ib′ (37,582 Da) (lane 5), AAC(3)-Ib (19,707 Da) (lane 6), and AAC(6′)-Ib′ (21,344 Da) (lane 7). Lane L, BenchMark prestained protein ladder (Invitrogen). Six micrograms of each protein was loaded onto the gel.

