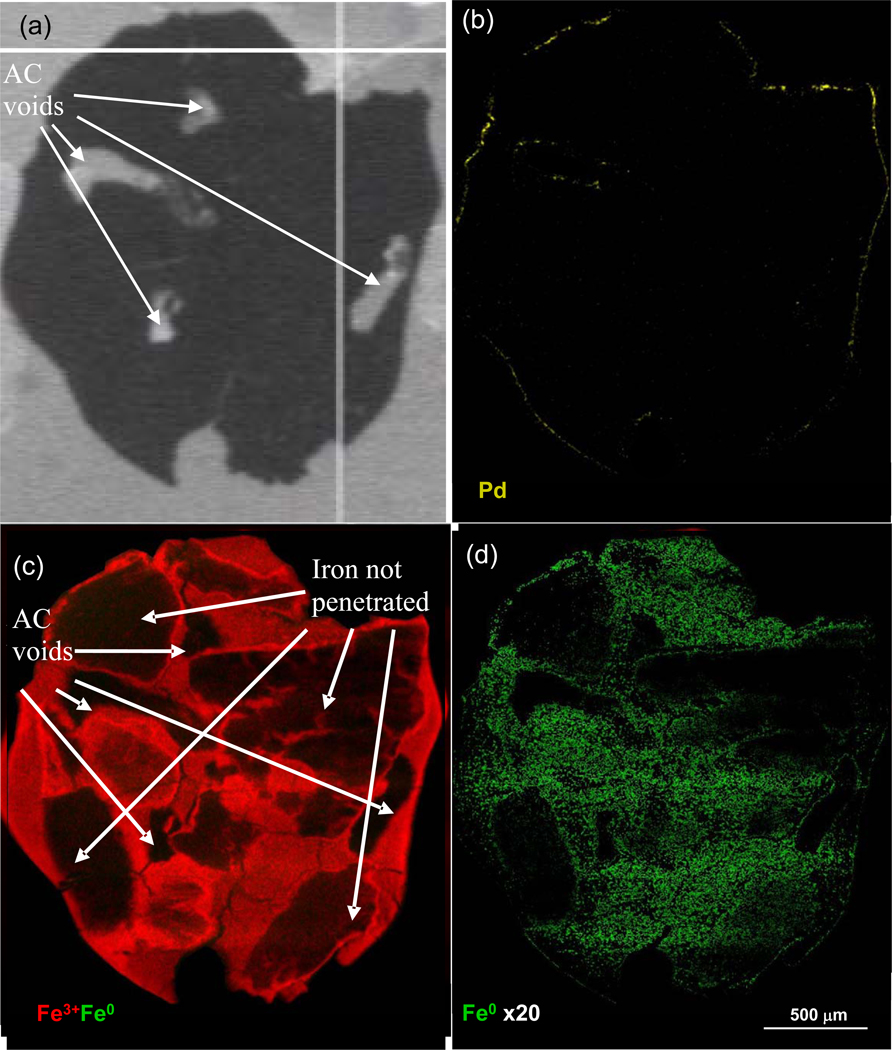
Figure 1.
Optical (a) and micro X-ray fluorescence images (b–d) of an nZVI/Pd-AC particle thin section showing distribution of Pd indicated in yellow (b), a Fe3+-Fe0 speciation image plotted on the same intensity scale (c), and the distribution of Fe0 with signal intensity increased 20 times that of Fe3+. Brighter color indicates higher abundance.

