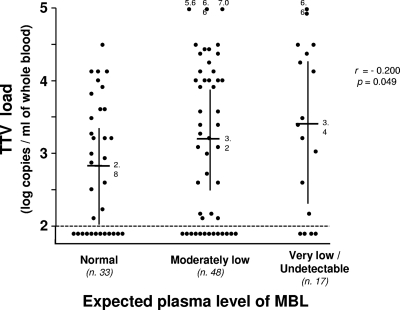
Fig. 1.
Individual TTV VLs in the blood of the 98 study patients, subdivided by expected MBL level. Horizontal bars, median VLs; vertical bars, 95% confidence limits. The broken line represents the lower limit of sensitivity of the quantitative detection method used. Symbols under this line represent patients who tested TTV negative. In statistical analyses, these patients were arbitrarily assigned a value of 2.0. The three groups of patients were not significantly different in terms of age and gender distribution.

