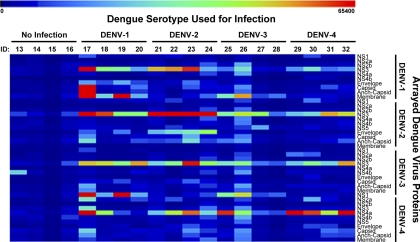
Fig. 7.
Serum IgG binding to DENV proteome after infection. The heat map depicts global IgG binding to the complete DENV-1 to -4 proteome for each infected macaque. Samples running from left to right represent the uninfected and infected macaques (four in each group). Color key at the top of the heat map represents signal intensity. The y axis label specifies the arrayed viral protein. ID, sample identifier.

