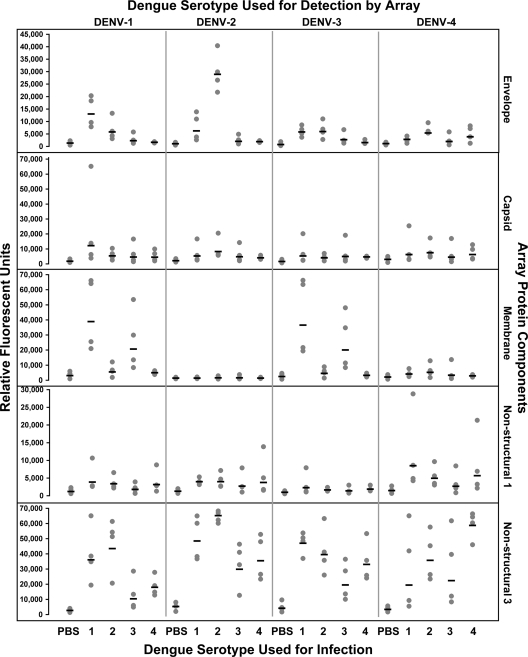
Fig. 8.
Scatter plot analyses of individual IgG responses to infection. The DENV serotype used for the infection is at the bottom of the graph, and the DENV serotype that was analyzed is at the top. Specific viral proteins analyzed are labeled at the right of the graph. The response (in relative fluorescent units) of each macaque against each DENV component is represented as a dot. The mean value in each group is represented by the horizontal bar.

