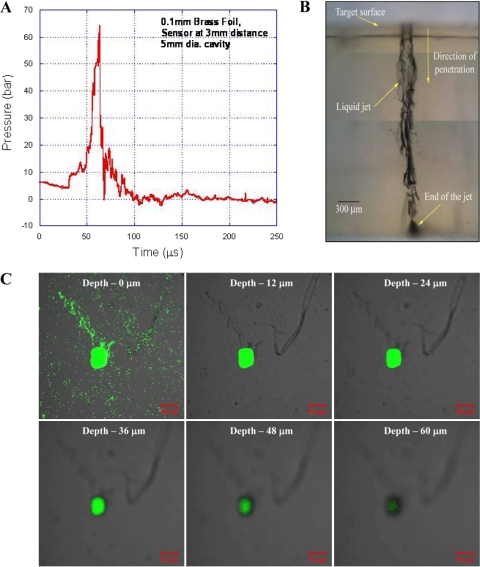
Fig. 2.
Liquid jet delivery from the device. (A) Graph showing variation in pressure in the liquid inside the chamber of the device over time. (1 bar = 105 Pa). (B) Microscopic image of liquid (water) jet delivered into the 4% agarose gel target merged using Adobe Photoshop. (C) Confocal images showing the penetration of fluorescent yellow-green latex beads delivered to 20% acrylamide gels using the device.

