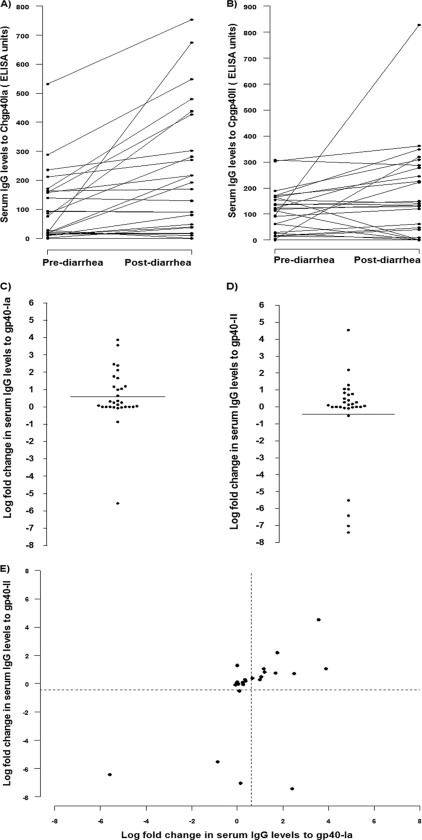
Fig. 3.
Serum IgG responses to homotypic and heterotypic gp40 in children infected with C. hominis subtype Ia (n = 30). (A and B) Pre- and postdiarrhea serum IgG levels in response to Chgp40Ia (A) and Cpgp40II (B) in each child. (C and D) Log-fold increase in IgG levels in response to Chgp40Ia (C) and Cpgp40II (D). (E) Correlation of log-fold changes in serum IgG levels in response to Chgp40Ia and Cpgp40II IgG in each child infected with C. hominis subtype Ia. The dashed vertical line and the dashed horizontal line indicate the mean log fold change in serum IgG levels to Chgp40 Ia and II, respectively.

