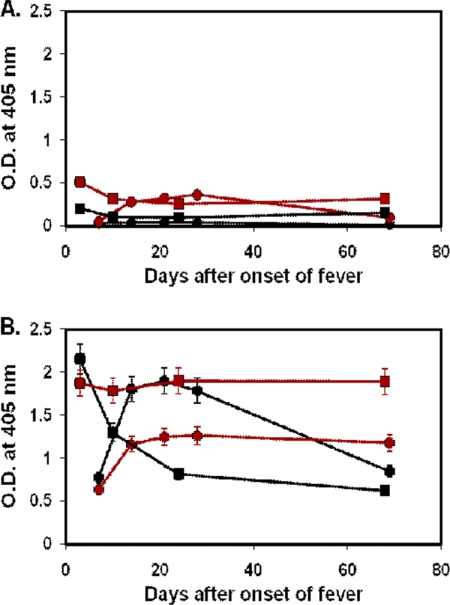
Fig. 6.
Time course of antibody responses of two typical type III (the secondary infection) patients to r47b and r56s antigens. The serum samples of patient MAK132 (circle) were collected at days 7, 14, 21, 28, and 69, and the serum samples of MAK168 (square) were collected at days 3, 10, 24, and 68. IgM (A) and IgG (B) specific for r47b (black) or r56s (red) in patient sera were measured by ELISA. The cutoff values are the same as in Fig. 1 and 2. The symbols represent the averages of two experiments, and the error bars represent ranges. O.D., optical density.

