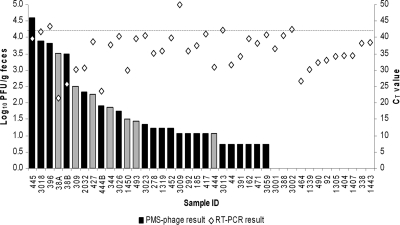
Fig. 1.
Comparison of the PMS-phage assay (log10 PFU/g of feces) and RT-PCR (CT value) results obtained for M. avium subsp. paratuberculosis testing of 39 U.S. bovine feces samples. Black bars indicate fecal samples from which at least some plaques tested M. avium subsp. paratuberculosis positive by plaque-IS900 PCR; gray bars indicate fecal samples for which this was not the case. The dashed line indicates the threshold cycle (CT) cutoff value above which a sample was considered M. avium subsp. paratuberculosis negative by RT-PCR.

