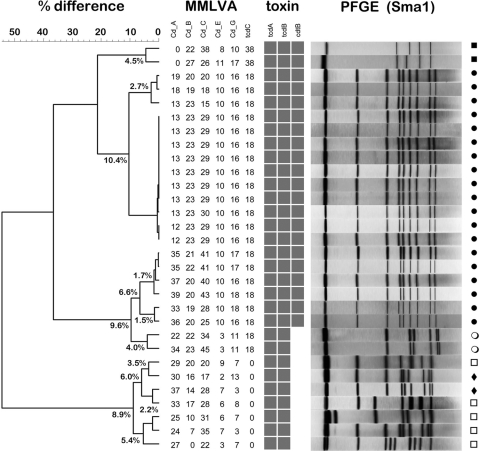
Fig. 1.
Dendrogram depicting MMLVA types compared to pulsotypes (n = 30) for an institutional outbreak. Clusters were defined as <5% difference based on the Manhattan distance measure. Within the NAP1 pulsotype (closed circles), four clusters are identified. A pair of NAP7 (closed squares) isolates formed a cluster, whereas a pair of NAP11 (closed diamonds) isolates did not form a cluster. Other unclassified pulsotypes (open circles, open squares) are noted. A matrix array format is used to identify the presence or absence of toxin genes (the tpi control gene is used as an amplification control and is not shown). Note the unusual pair of CDI cases (open circles) which has the tcdC deletion but not the binary toxin. PFGE (SmaI digest) results correlated closely with those of MMLVA.

