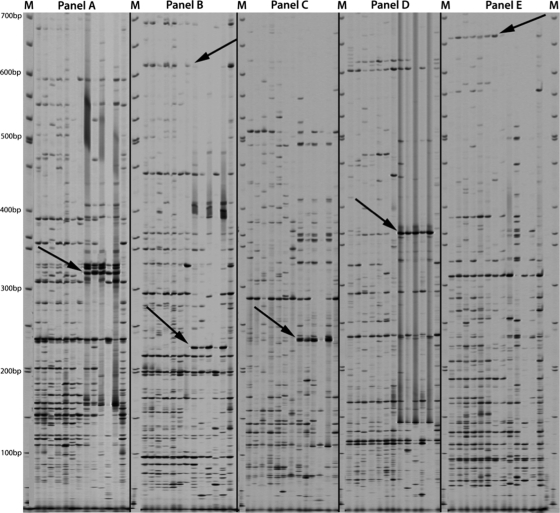
Fig. 1.
Composite AFLP gel comparison of fecal and tissue-associated M. avium subsp. paratuberculosis isolates. M, molecular weight markers. Isolates in each panel, from left to right, are as follows: fecal isolates T12, T136, T139, T140, T141, and T143; ATCC 19698 (internal control); tissue-associated isolates 19851, 43015, 43544, 43545, and 49164; duplicate internal control (ATCC 19698). (A) AFLP analysis with primers P-CG and M-AC. The arrow points to region 1 (330 bp), found only in tissue-associated isolates. (B) AFLP analysis with primers P-GC and M-AC. The top arrow points to region 5 (620 bp), present in fecal isolates only; the lower arrow points to region 2 (220 bp), present in tissue-associated isolates only. (C) AFLP analysis with primers P-GG and M-AC. The arrow points to region 3 (240 bp), present in tissue-associated isolates only. (D) AFLP analysis with primers P-GG and M-AG. The arrow points to region 4 (365 bp), present in tissue-associated isolates only. (E) AFLP analysis with primers P-GG and M-AT. The arrow points to region 6 (660 bp), present in fecal isolates only.

