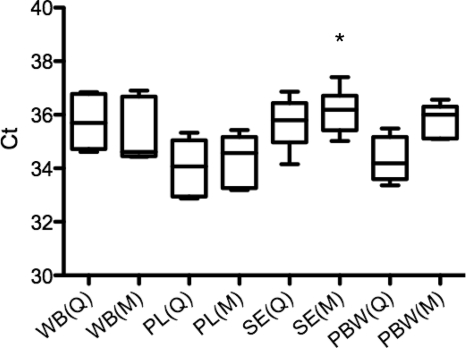
Fig. 3.
Box plot of the mean CT for DNA extracted from whole blood, plasma, serum, and PBW spiked with 103 L. interrogans/ml. Bacteremia was assessed using qPCR assay with the TaqMan probe targeting lipL32. A one-way ANOVA (Dunnett's multiple comparison test; *, P < 0.05) was used to compare the mean CT of DNA extracted from whole blood (WB), plasma (PL), serum (SE), and PBW using the Qiagen (Q) and Maxwell (M) DNA purification kits. Each box represents the interquartile spread between the first and third quartiles (25th and 75th percentiles). The line inside the box is the median, and the lines extending from the box represent minimum and maximum values.

