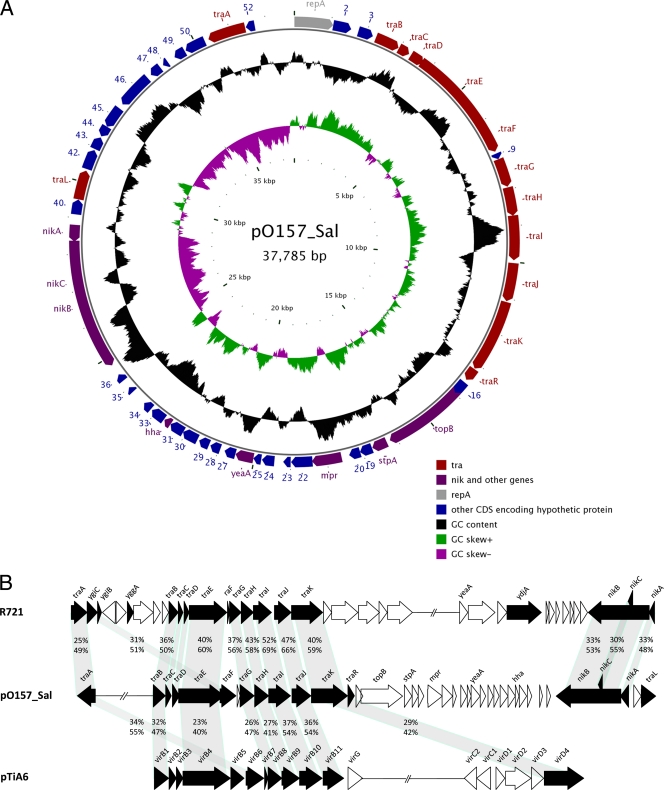
Fig. 1.
Plasmid map and comparison with other conjugative plasmids. (A) Representational circular map of pO157_Sal. The inside circle is the G+C skew. The middle circle is the G+C content. The outside circle is the genetic organization of ORFs within the plasmid. The direction of transcription of each ORF is indicated. Genes are color coded as indicated. (B) Comparison of the tra regions of pO157_sal, R721, and pTiA6. Sequences for other plasmids were obtained from GenBank (accession numbers NC_002525 and NC_002377 for R721 and pTiA6, respectively). Filled arrows and arrowheads are T4SS-related genes. The percentages of amino acid identity (above) and similarity (below) are shown between the homologous genes.

