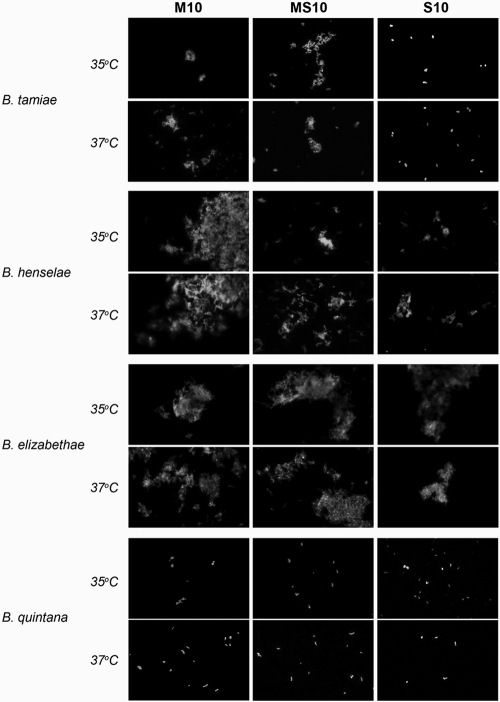
Fig. 2.
Differences in autoagglutination between different temperatures and media after 36 h. Representative immunofluorescent micrographs of each bacterial strain grown in axenic media (M10, MS10, and S10) at both 35°C and 37°C are shown. Images were taken with a ×40 objective before the contrast was adjusted, and the images were cropped using Adobe Photoshop.

