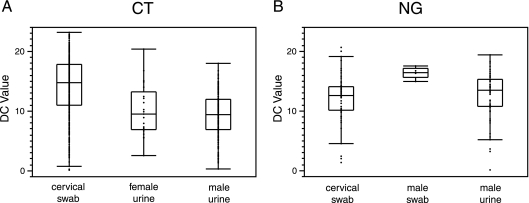
Fig. 1.
Plot of DC values for Abbott N. gonorrhoeae (NG) and C. trachomatis (CT) amplification reactions from different specimen types. (A) DC values for C. trachomatis amplification reactions. Box and whisker plots are shown. The outer edges of the boxes represent the 25th and 75th percentiles, respectively, and the dividing line between them is the median. The whiskers extend from the lower and upper quartiles to the lowest and highest data points, respectively, still within a region bounded by the interquartile range multiplied by 1.5. (B) DC values for N. gonorrhoeae amplification reactions.

