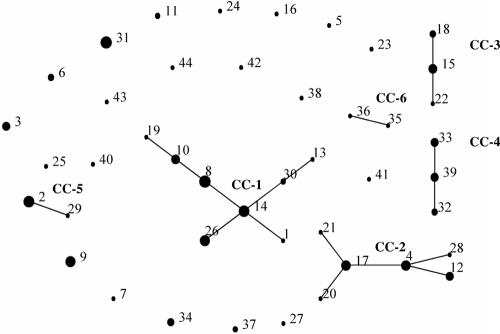
Fig. 2.
eBURST representation of relationships between sequence types and clonal complexes. Clonal complexes are designated CC-1 to CC-6. Separate dots represent sequence types, which are designated by sequence type number. The size of each dot correlates with the number of isolates in that sequence type.

