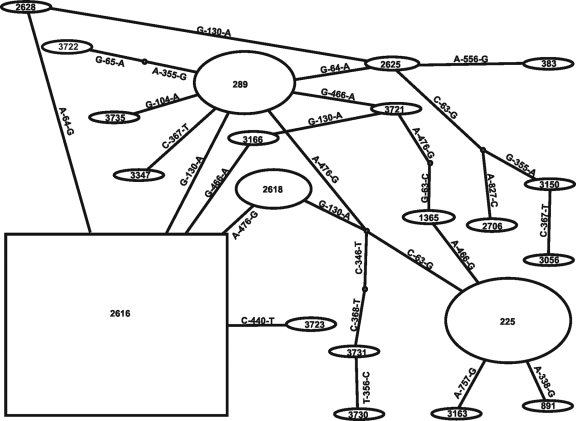
Fig. 3.
Most likely evolutionary pathways between NG-MAST STs. Predicted pathways were obtained using statistical parsimony as implemented in the TCS program (3). The prevalence of isolates of NG-MAST STs is shown by the size of the ovals and the square. The latter indicates the predicted ancestral ST. Nucleotide substitutions between connected STs are indicated.

