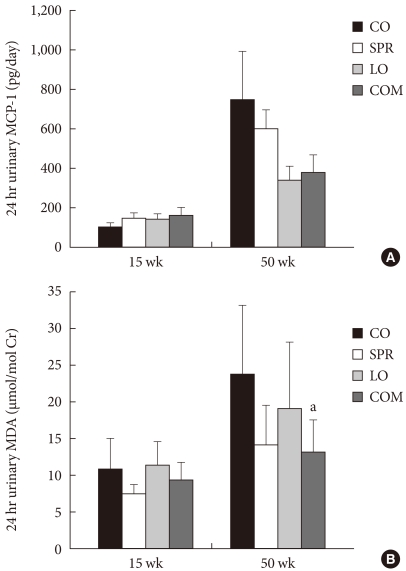
Fig. 4.
Twenty-four hour urinary monocyte chemotactic protein- 1 (MCP-1) (A) and malondialdehyde (MDA) (B) levels. MCP-1 levels were not different among the four groups, but showed a decreasing trend in the LO and COM groups. MDA levels were significantly decreased in the COM group compared to the CO group. CO, control Otsuka-Long-Evans-Tokushima-Fatty (OLETF) group; SPR, spironolactone-treated OLETF group; LO, losartan-treated OLETF group; COM, spironolactone- and losartan-treated OLETF group. aP<0.05 compared with CO group.

