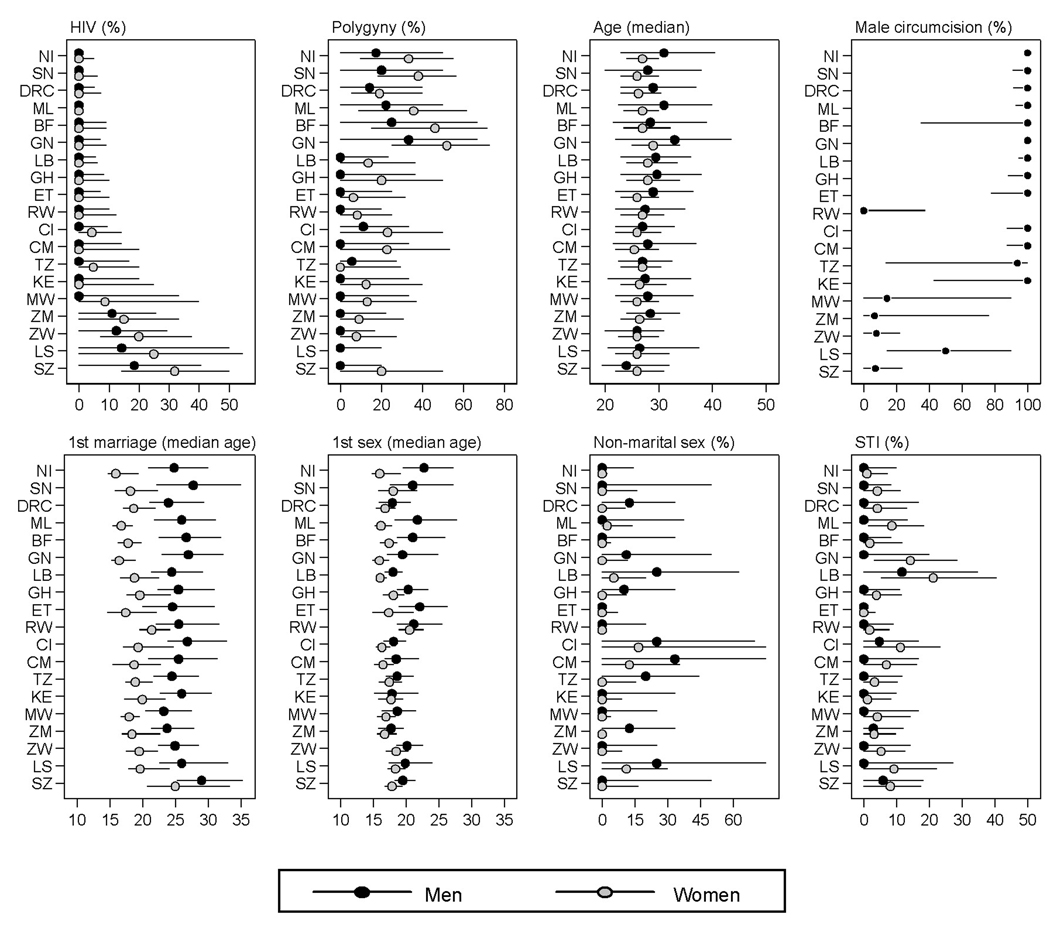
Figure 2. Sample descriptive statistics (10–90th percentiles range and median) by country and sex.
Notes: The unit of analysis is a survey cluster. The range between the 10th and 90th percentile is depicted by the horizontal lines; the dots represent the median for men and women, respectively. Countries are sorted along the Y-axis according to national HIV prevalence rates for both sexes combined [48]. Countries included: Burkina Faso (BF, 2003), Democratic Republic of Congo (DRC, 2007), Ivory Coast (CI, 2005), Cameroon (CM, 2004), Ghana (GH, 2003), Guinea (GN, 2005), Kenya (KE, 2003), Liberia (LB, 2007), Lesotho (LS, 2004), Mali (ML, 2006), Malawi (MW, 2004), Niger (NI, 2006), Rwanda (RW, 2005), Senegal (SN, 2005), Swaziland (SW, 2006–07), Tanzania (TZ, 2004–05), Zambia (ZM, 2007), Zimbabwe (ZW, 2005–06). The question about the number of co-wives was not included in the female questionnaire for Lesotho. The distribution for the type of place of residence is not shown because survey clusters are either entirely urban or rural, and the 10–90th percentile range spans both values for all countries.

