Fig. 4.
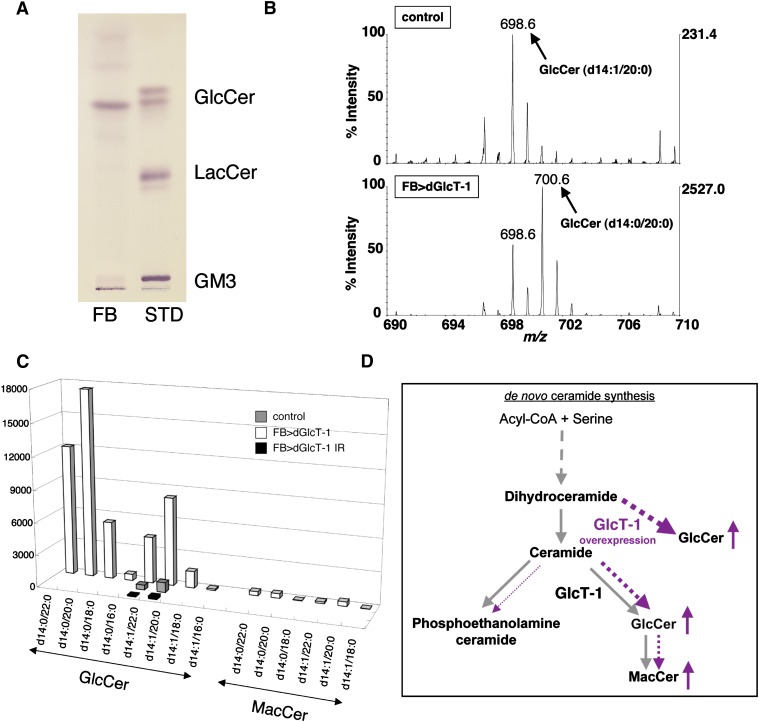
GlcCer is the sole GSL in the fat body. A: TLC analysis of GSLs from the fat body demonstrated that GlcCer is the sole GSL in the fat body. Total lipid extracts corresponding to two larvae were assayed (FB). Two micrograms of GlcCer, LacCer, and ganglioside GM3 were applied as standard GSLs (STD). B: LC/MS spectra from control (upper panel) and dGlcT-1-overexpressing fat bodies (FB>dGlcT-1; lower panel). Scans from m/z 690 to 710 are shown. Peaks of m/z 698.6 and 700.6 correspond to GlcCer having d14:1/20:0 and d14:0/20:0 conformations, respectively. C: Total GlcCer and MacCer levels in lipid extracts from fat bodies of control, FB>dGlcT-1, and FB>dGlcT-1 IR larvae are shown. D: Model showing the effect of overexpressing dGlcT-1 in the fat body. When dGlcT-1 is overexpressed in the fat body, dGlcT-1 adds glucose not only to regular ceramide but also to dihydroceramide (dotted line).

