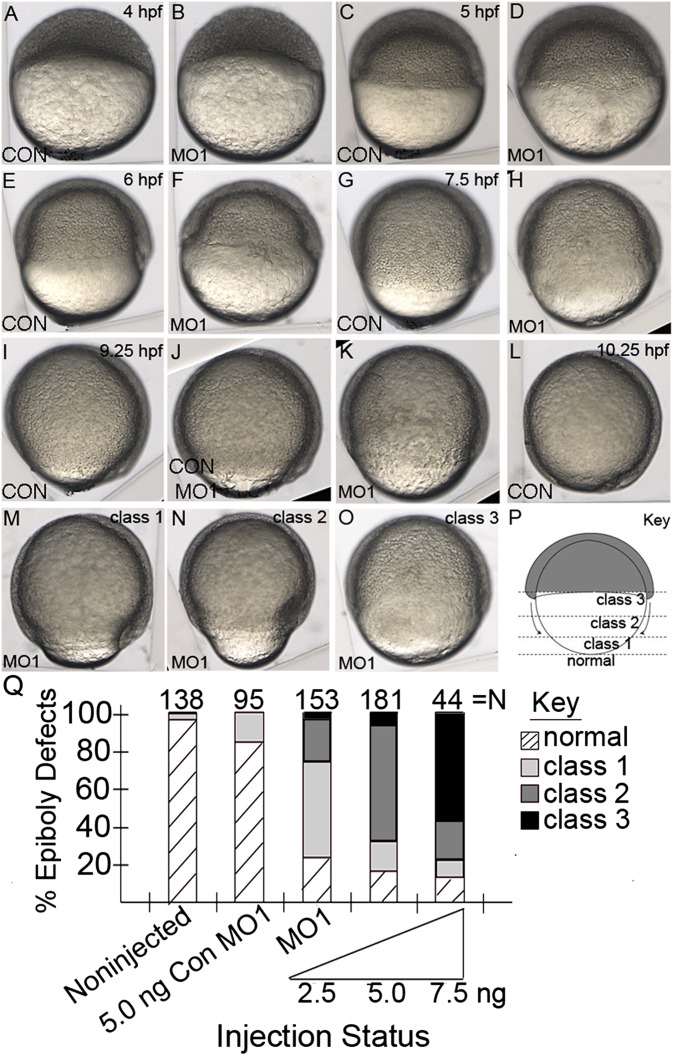
Fig.3.
Reduced npc1 expression results in epiboly delay. (A–O) Lateral views of live control or MO1-injected embryos 4-10.25 hpf. (A–D) Both control and time-matched MO1-injected embryos progressed to sphere stage (A, B) and 40% epiboly (C, D) at similar rates. (E, F) Control embryos were at shield stage at 6 hpf (E) and time-matched morphant embryo were at 45% epiboly (F). (G, H) Control embryos were at 75% epiboly at 7.5 hpf (G) while time-matched MO1-injected embryos were at approximately 50% epiboly (H). (I–K) Noninjected or Con MO1-injected controls were at 95% epiboly at 9.25 hpf (I, J), while MO1-injected embryos were at 60-75% epiboly (K). (L) Control embryos finished epiboly by 10.25 hpf (L), while time-matched MO1-injected embryos had delayed epiboly to varying degrees; class 1 epiboly-delay phenotype embryos were delayed at 90-95% epiboly (M), class 2 phenotypes were delayed to 70-89% epiboly (N), and class 3 phenotypes were delayed to 69% epiboly or earlier (O). (P) Schematic of embryo during epiboly showing blastoderm cells (gray) migrating downward over the vegetal yolk (white). Dotted lines designate different migration points of the blastoderm cells in morpholino-injected embryos when noninjected controls complete epiboly. (Q) The effect of injecting different concentrations of MO1 or Con MO1 on epiboly.

