
Figure 4.
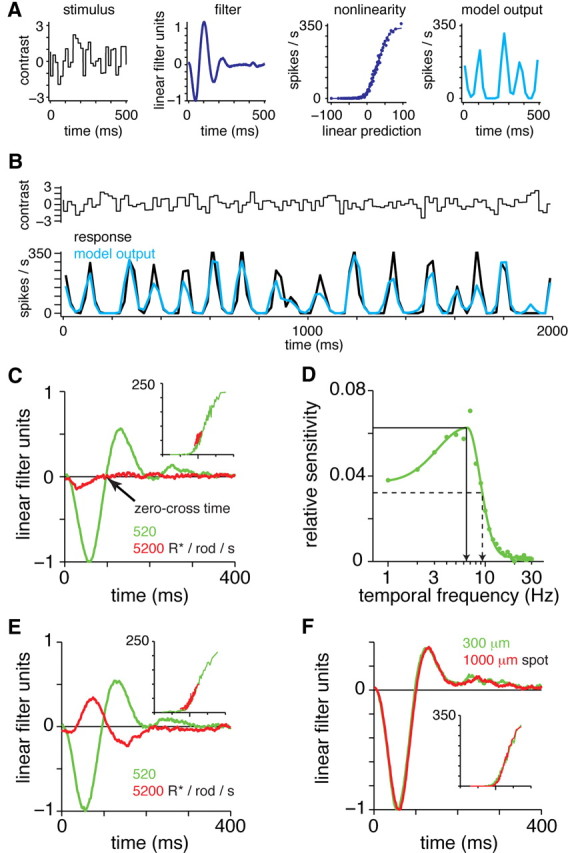
Linear–nonlinear model describes the temporal tuning of the receptive field center in ganglion cells. A, Linear–nonlinear model. The stimulus is shown in contrast units, where the mean luminance is zero and the SD is 1 (range, −3.3 to +3.3; black to white). The stimulus is filtered to generate a linear prediction, and the linear prediction is passed through a nonlinear function to generate the model output (in spikes per second). B, Model explains most of the variance in the response of a Gnat2cpfl3 ganglion cell (same cell as in A). Model and response represent firing rates in 20 ms bins. In this case, the r2 between model and data was 0.76. C, LN models for a Gnat2cpfl3 OFF ganglion cell at two light levels. Spot (1 mm diameter) centered over the cell body was modulated by white noise while the background was maintained at the mean luminance. Filters were scaled to align the nonlinearities (see Materials and Methods). The nonlinearities (inset) plot the linear model (arbitrary units; zero position indicated by elongated tick) versus firing rate (from zero to maximum rate; shown in spikes per second). The response was nearly saturated at 5200 R*/rod/s. In the 520 R*/rod/s mean condition, response speed was quantified by the zero-cross time: the time when the filter crossed zero following the first response peak (arrow). D, Fourier transform of the filter in C. (520 R*/rod/s mean condition). The temporal frequencies corresponding to the maximal amplitude (TFpeak) and the half-maximal amplitude (TF50) are indicated by the solid and dashed lines, respectively. E, Same as C, except the spot was presented against a dark background. In this case, the response at the mean of 5200 R*/rod/s showed an inverted sign (ON filter), suggesting a surround-mediated response to scattered light in the presence of a saturated center. F, A Gnat2cpfl3 OFF ganglion cell showed similar responses to two spot sizes (background equaled the mean luminance of spot modulation).