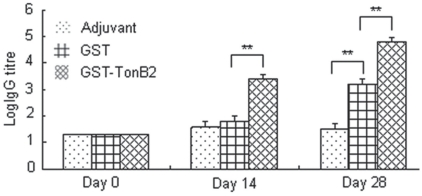
Figure 2.
Antibody responses of mice as detected in the TonB2 enzyme-linked immunosorbent assay (n = 12). Blood was collected on days 0 (day of initial vaccination), 14 (day of booster vaccination), and 28 (day of A. pleuropneumoniae challenge). The vertical bars represent 1 standard deviation. The double asterisks indicate a highly statistically significant difference (P < 0.01; Student’s t-test) between the groups.

