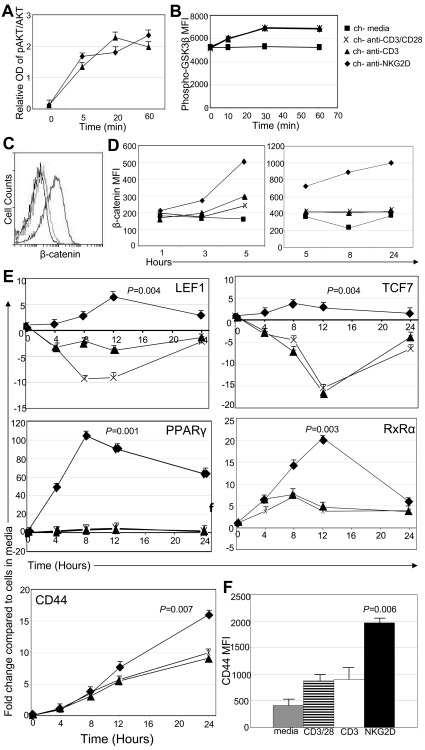
Figure 1.
Signaling through the chNKG2D receptor activates AKT and β-catenin. (A) chNKG2D T cells were stimulated with anti-CD3 or anti-NKG2D Ab-coated beads. Phosphorylated and total AKT were measured with In-Cell ELISA. Data are shown as mean ± SD from 1 donor and are representative of data from 2 donors. (B) Phosphorylated (Ser9) GSK3β expression in chNKG2D T cells after stimulation with media, anti-CD3/CD28–, anti-CD3–, or anti-NKG2D–coated beads. Data shown were obtained from 1 donor and are representative of data from 5 donors. (C) Representative histogram of chNKG2D T cells stained with Abs specific for β-catenin 24 hours after stimulation with media (black), anti-CD3–coated (light gray), or anti-NKG2D–coated (dark gray) beads. (D) β-Catenin expression in chNKG2D T cells after stimulation with media, anti-CD3/CD28–, anti-CD3–, or anti-NKG2D–coated beads. Data shown were obtained from 1 donor and are representative of data from ≥ 6 donors. (E) chNKG2D T cells were stimulated with beads coated with anti-CD3/CD28, anti-CD3, or anti-NKG2D Abs, and gene expression was determined by RT-PCR. Data are shown as the fold change in expression compared with T cells cultured in media at each time point. Data are shown as mean ± SD from 1 donor and are representative of data from ≥ 3 donors. (F) chNKG2D T cells were stimulated with media, anti-CD3/CD28–, anti-CD3–, or anti-NKG2D–coated beads. After 24 hours, CD44 cell surface expression was determined by FACS. Data are shown as an average ± SD of 4 donors. Stimulating chNKG2D T cells with anti-NKG2D–coated beads significantly increased expression of β-catenin–induced genes compared with stimulating T cells through CD3 or CD3/CD28.

