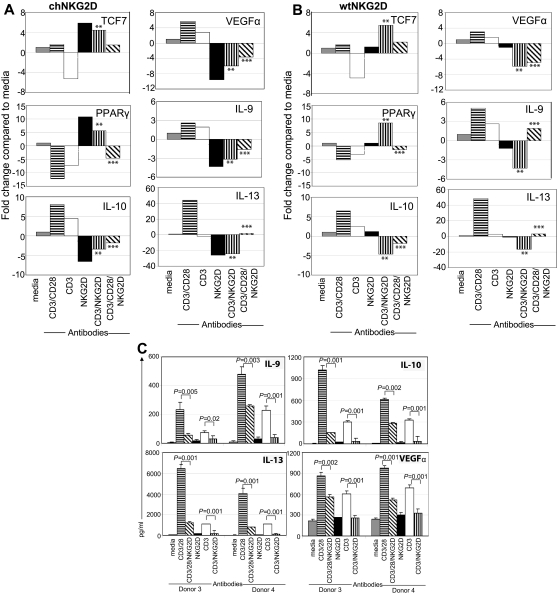
Figure 7.
Activation of T cells through NKG2D modulates CD3/CD28 signal. (A) chNKG2D or (B) wtNKG2D T cells were stimulated with media, anti-CD3/28–, anti-CD3–, anti-NKG2D–, anti-CD3– and anti-NKG2D–, or anti-CD3–, anti-CD28–, and anti-NKG2D–coated beads. After 8 hours gene expression was determined by RT-PCR. Data are shown as the fold change in gene expression compared with T cells cultured in media. Data shown were obtained from 1 donor and are representative of data from ≥ 3 donors. Stimulation of T cells through CD3/NKG2D significantly changed gene expression compared with CD3 stimulation (**P < .05), and stimulation through CD3/CD28/NKG2D significantly changed gene expression compared with CD3/CD28 stimulation (***P < .05). (C) Activated, nontransduced T cells were stimulated with media, anti-CD3/CD28–, anti-CD3–, anti-NKG2D–, anti-CD3– and anti-NKG2D–, or anti-CD3–, anti-CD28–, and anti-NKG2D–coated beads. After 72 hours, IL-9, IL-10, IL-13, and VEGFα in conditioned medium were determined by Luminex analysis. Cytokine secretion data are presented as mean ± SD and are from 2 donors (as indicated by donors 3 and 4). Stimulation of T cells through CD3/NKG2D significantly decreased cytokine secretion compared with CD3 stimulation, and stimulation through CD3/CD28/NKG2D significantly decreased cytokine secretion compared with CD3/CD28 stimulation.

