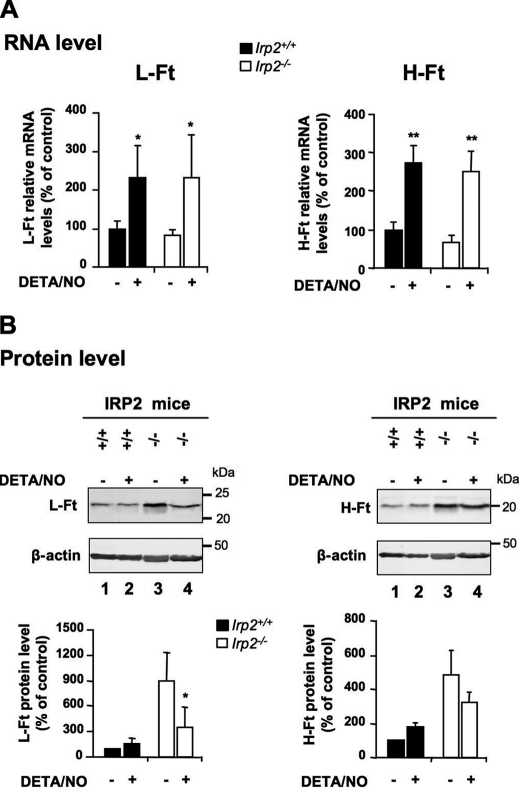
FIGURE 4.
NO regulation of L- and H-Ft in IRP2-deficient BMMs. Wild-type and IRP2-null BMMs were exposed to 250 μm DETA/NO for 18 h. A, L- and H-Ft mRNA levels were analyzed by real-time quantitative PCR. The histograms display mRNA expression (mean ± S.D., n = 3) as a percentage of untreated wild-type cells after normalization to 18 S ribosomal RNA levels. B, Western blot analysis of L-Ft (left panels) and H-Ft (right panels) levels in cytosolic extracts. Representative immunoblots are shown. β-actin was used as a loading control. The histograms show L- and H-Ft expression (mean ± S.D., n = 3) as a percentage of untreated wild-type cells after normalization to β-actin. *, p < 0.05, **, p < 0.01, Student's t test.

