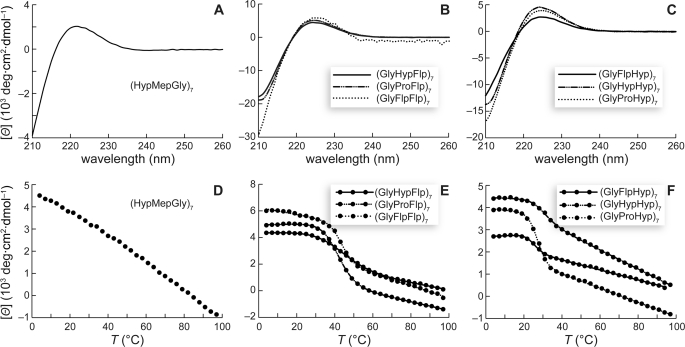
FIGURE 2.
Conformational analysis of peptides. A–C, circular dichroism spectra of peptide solutions (∼0.2 mm in 50 mm sodium phosphate buffer, pH 7.0; except (GlyFlpFlp)7, which was ∼0.01 mm) at 4 °C after incubating at 4 °C for ≥24 h. D–F, effect of temperature on the molar ellipticity at 225 nm. Data were recorded at 3-°C intervals after a 5-min equilibration.

