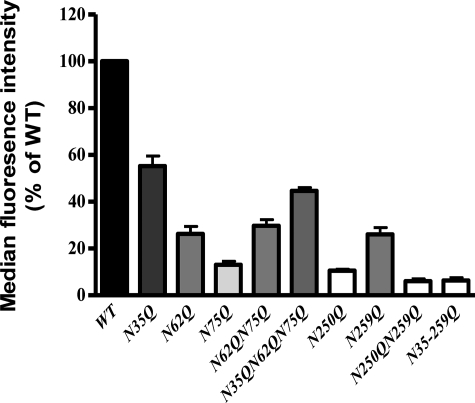
FIGURE 2.
Cell surface expression of WT hPAR1 (WT) and glycosylation-deficient mutant hPAR1 receptor in KNRK cells assessed by FACS. Cells at ∼90% confluence were harvested and incubated with the ATAP-2 antibody before incubation with an anti-mouse FITC-conjugated antibody. Results are expressed as a percentage of the median fluorescence obtained with WT hPAR1 cells. The bars represent mean ± S.E. (error bars) of measurements for three independent experiments. The overall comparison showed that there were significant differences between 10 groups (p < 0.0001). Tukey's multiple comparison test indicated that the cell surface expression of all of the mutant receptors was significantly different from WT hPAR1 (p < 0.001).

