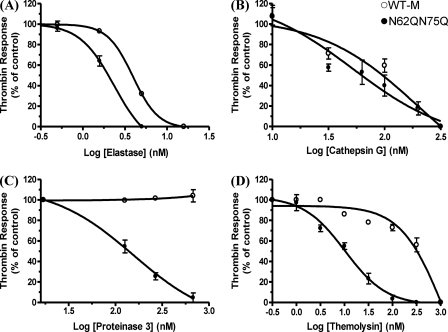
FIGURE 7.
Analysis of WT-M and hPAR1(N62Q/N75Q) calcium signaling following proteinase stimuli. WT-M and N62Q/N75Q in KNRK cells were challenged by the addition of elastase (A), the addition of cathepsin G (B), the addition of proteinase 3 (C), or the addition of thermolysin (D) followed by the addition of 5 nm thrombin and finally the addition of 2 μm A23187. Results are expressed as mean ± S.E. from at least three independent experiments.

