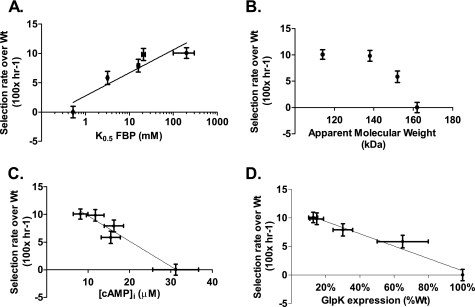
FIGURE 2.
Plots of the apparent dependence of relative fitness on (A) FBP affinity (log10 transformed), (B) apparent molecular weight (an indirect measure of the tetramer dissociation constant), (C) intracellular cAMP, and (D) glpK expression. Relative fitness is expressed as the approximate growth rate increase relative to wild type (h−1, × 100), calculated as described under “Experimental Procedures.” No trend line is included in panel (B) because the relationship does not appear to be linear. The FBP affinity of V61L is simply estimated to be >100 mm, but has been plotted as 150 mm ± 50 mm.

