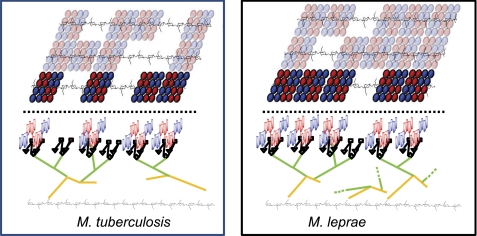
FIGURE 5.
Left, model of M. tuberculosis cell wall; right, model of M. leprae cell wall. Top portion of figures (above dashed line) shows an arrangement of the covalently bound mycolates present in the inner leaflet of the outer membrane as viewed looking down at the cell wall. The peptidoglycan beneath the mycolates is shown, but the connecting AG is not. The orientation of PG versus the mycolates is arbitrary; the flexibility of the AG would allow any orientation. The positions of the “blank” areas devoid of covalently linked mycolates are also arbitrary, but the percent coverage of the PG layer is ∼63% for M. tuberculosis and ∼80% for M. leprae (see Table 3). The blank areas are presumably filled with noncovalently attached lipids such as trehalose mono- and di-mycolates. Bottom portion of figures (below dashed line) show a side view of the mycolates attached to PG for the mycolate clusters in bright colors shown in the top view. The PG is shown in black with only the GlcNAc-MurNAc repeat units designated. The AG is shown in gold (galactan) and green (arabinan). The nonreducing pentaarabinoside is shown with diamonds, squares, and triangles as in Fig. 4C. The mycolates are as shown in Fig. 4, B and D, but are not in scale with the rest of the drawing; rather they are shown much smaller for clarity.

