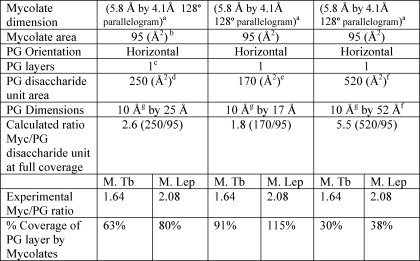
TABLE 3.
Calculated percent coverage of the PG layer by the mycolate layer for M. leprae and M. tuberculosis cell wall at different PG conformations
a Data are based on measurement for C-20 fatty acids by tunneling microscopy (34).
b Data are calculated from mycolate dimensions and are reasonably consistent with studies on Langmuir monolayers (31), which yields 78 Å2 for four chains.
c Data are based on electron cryotomography in E. coli (35).
d Data indicate the measured area in E. coli (37).
e Data indicate the measured area in a different strain of E. coli (38).
f 52 Å is the distance of a fully extended peptide chain and the associated glycan (39); glycan chains (which may not be perfectly parallel) were found to be 50–80 Å apart by electron cryotomography (35).
g Data are calculated from the known 10 Å disaccharide length.

