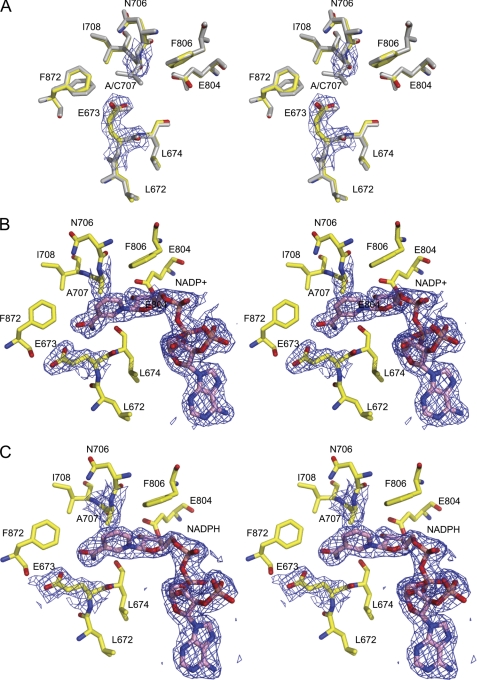
FIGURE 6.
Stereoview of the active site of the apo-Ct-FDH C707A mutant (A) and its complexes with NADP+ (B) or NADPH (C). The 2|Fo| − |Fc| electron density maps of the active site alanine 707, glutamate 673, and NADP+/NADPH contoured at 1 σ are shown in blue. Panel A also shows the superimposed active site of WT Ct-FDH (gray).

