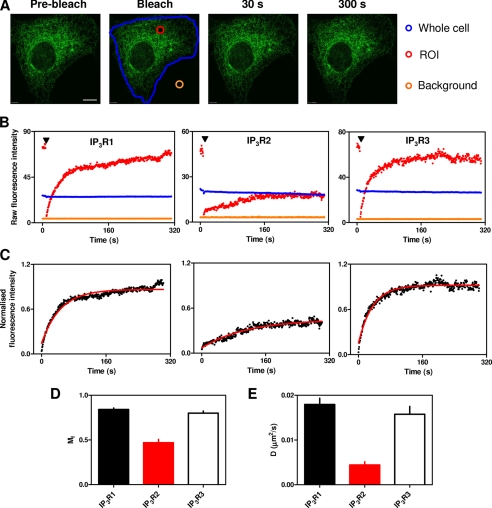
FIGURE 3.
Mobilities of IP3R subtypes. A, a typical FRAP experiment is shown for EGFP-IP3R1. Fluorescence was recorded from the entire cell (blue outline), the bleached ROI (red circle), and a background area outside the cell (orange circle). Typical images are shown before and after bleaching. Scale bar = 10 μm. B, raw fluorescence intensities are shown for the three regions color-coded as described for A. The arrowheads denote bleaching. C, normalized fluorescence intensities are shown after correction for background and loss of fluorescence with time. Red lines show the fitted monoexponential recovery curves (see “Experimental Procedures”). Mf (D) and D (E) are shown for each IP3R subtype. The results in D and E are means ± S.E. from 23–30 cells. Supplemental Fig. S5 provides a comparison of the same data analyzed using another commonly used equation to describe the recovery phase.

