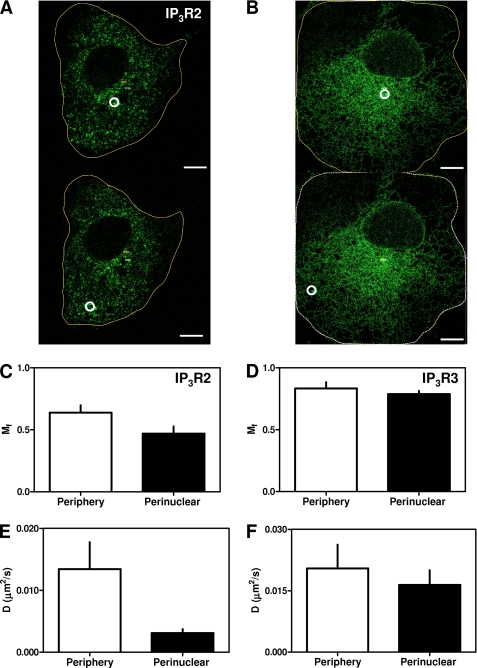
FIGURE 6.
Differential mobility of IP3R2 in different subcellular regions. Typical FRAP experiments are shown for EGFP-IP3R2 (A) and EGFP-IP3R3 (B), with ROI (white circles) chosen to capture IP3R within the perinuclear (upper panels) or peripheral (lower panels) regions of the cell. Images are shown after recovery periods of at least 300 s. Scale bars = 10 μm. The results are typical of recordings from 10–15 cells from three independent transfections. Summary results (means ± S.E., n = 10–15) are shown for Mf (C and D) and D (E and F) determined for each IP3R subtype in the cell periphery (open bars) or perinuclear region (closed bars).

